Identifying Value Bets in Sports Using Machine Learning EDA
If you need to read Part 1.
Go to Part 2.
Check out the Methodology
Exploring the Data
In this section, let’s explore the data. The total number of rows in this data set is 149,627.
First let’s examine the average home and away odds given by Oddsportal.
| Statistic | Average Home Odds | Average Away Odds |
|---|---|---|
| Mean | -136.77 | 132.95 |
| Min | -13333.00 | -6667.00 |
| Max | 2413.00 | 3685.00 |
| Standard Deviation | 548.93 | 402.37 |
Generally speaking, home teams are more favored than away teams. Let’s visualize the distribution of the average home and away odds as well.
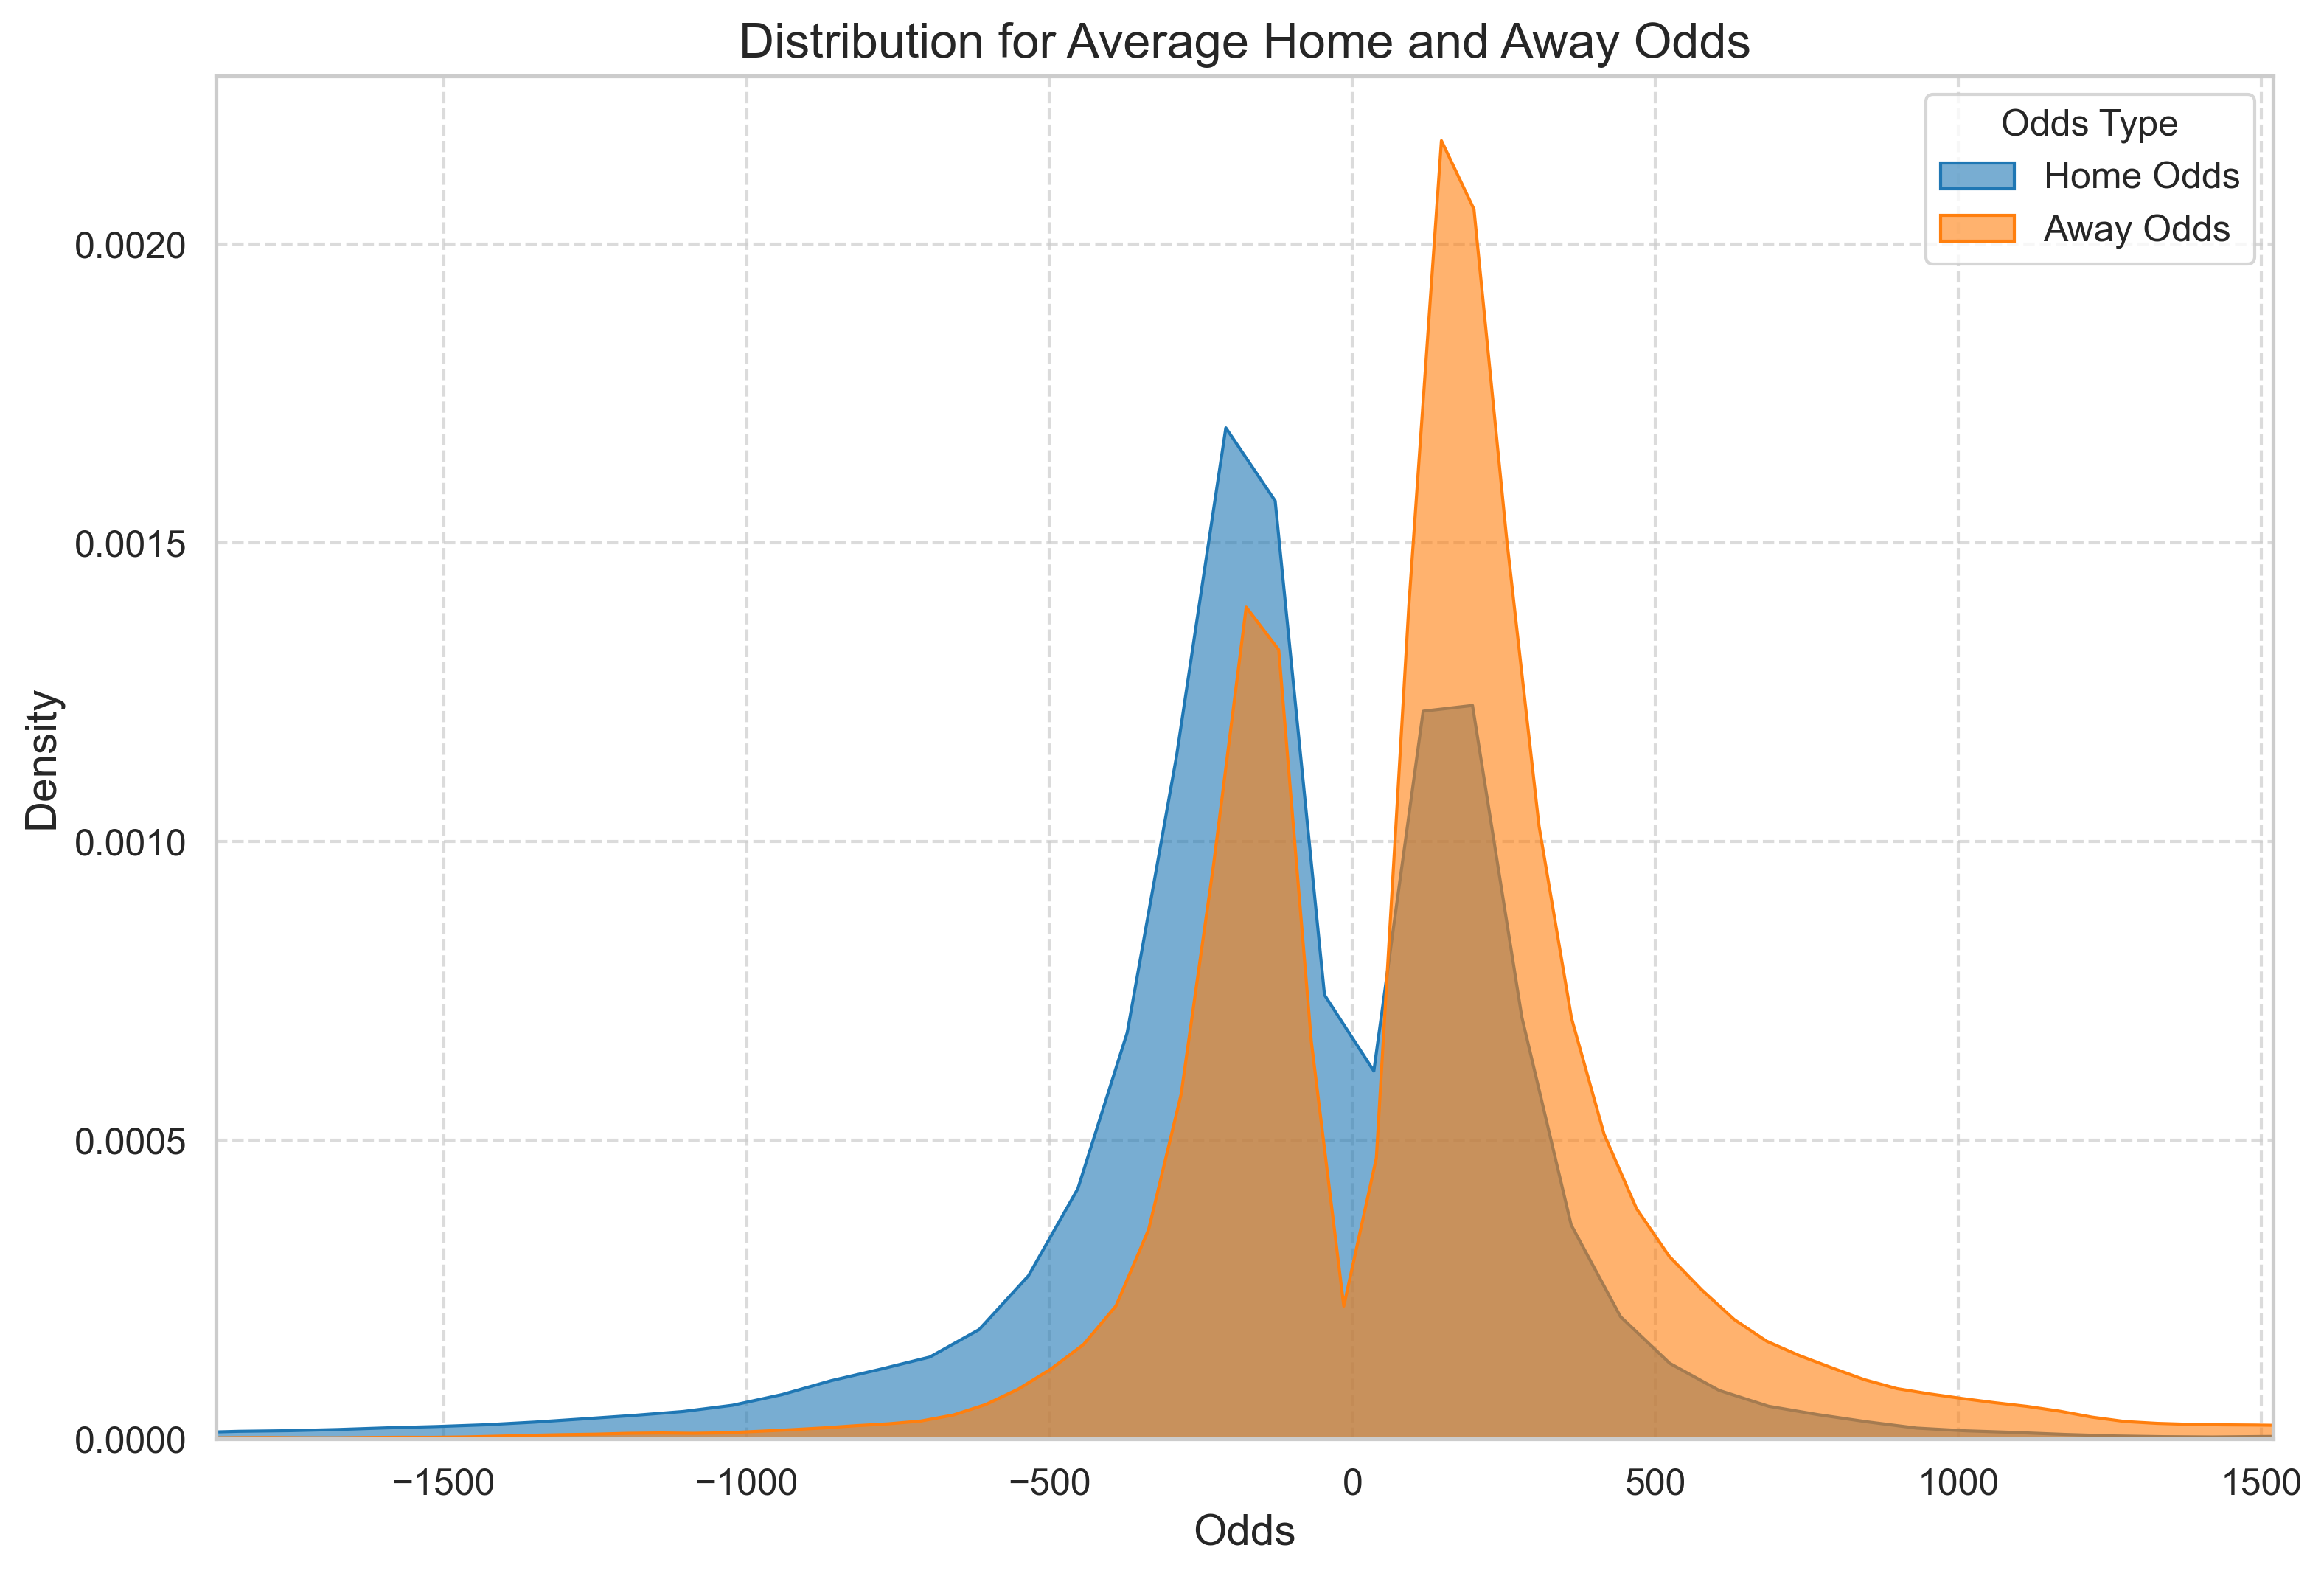
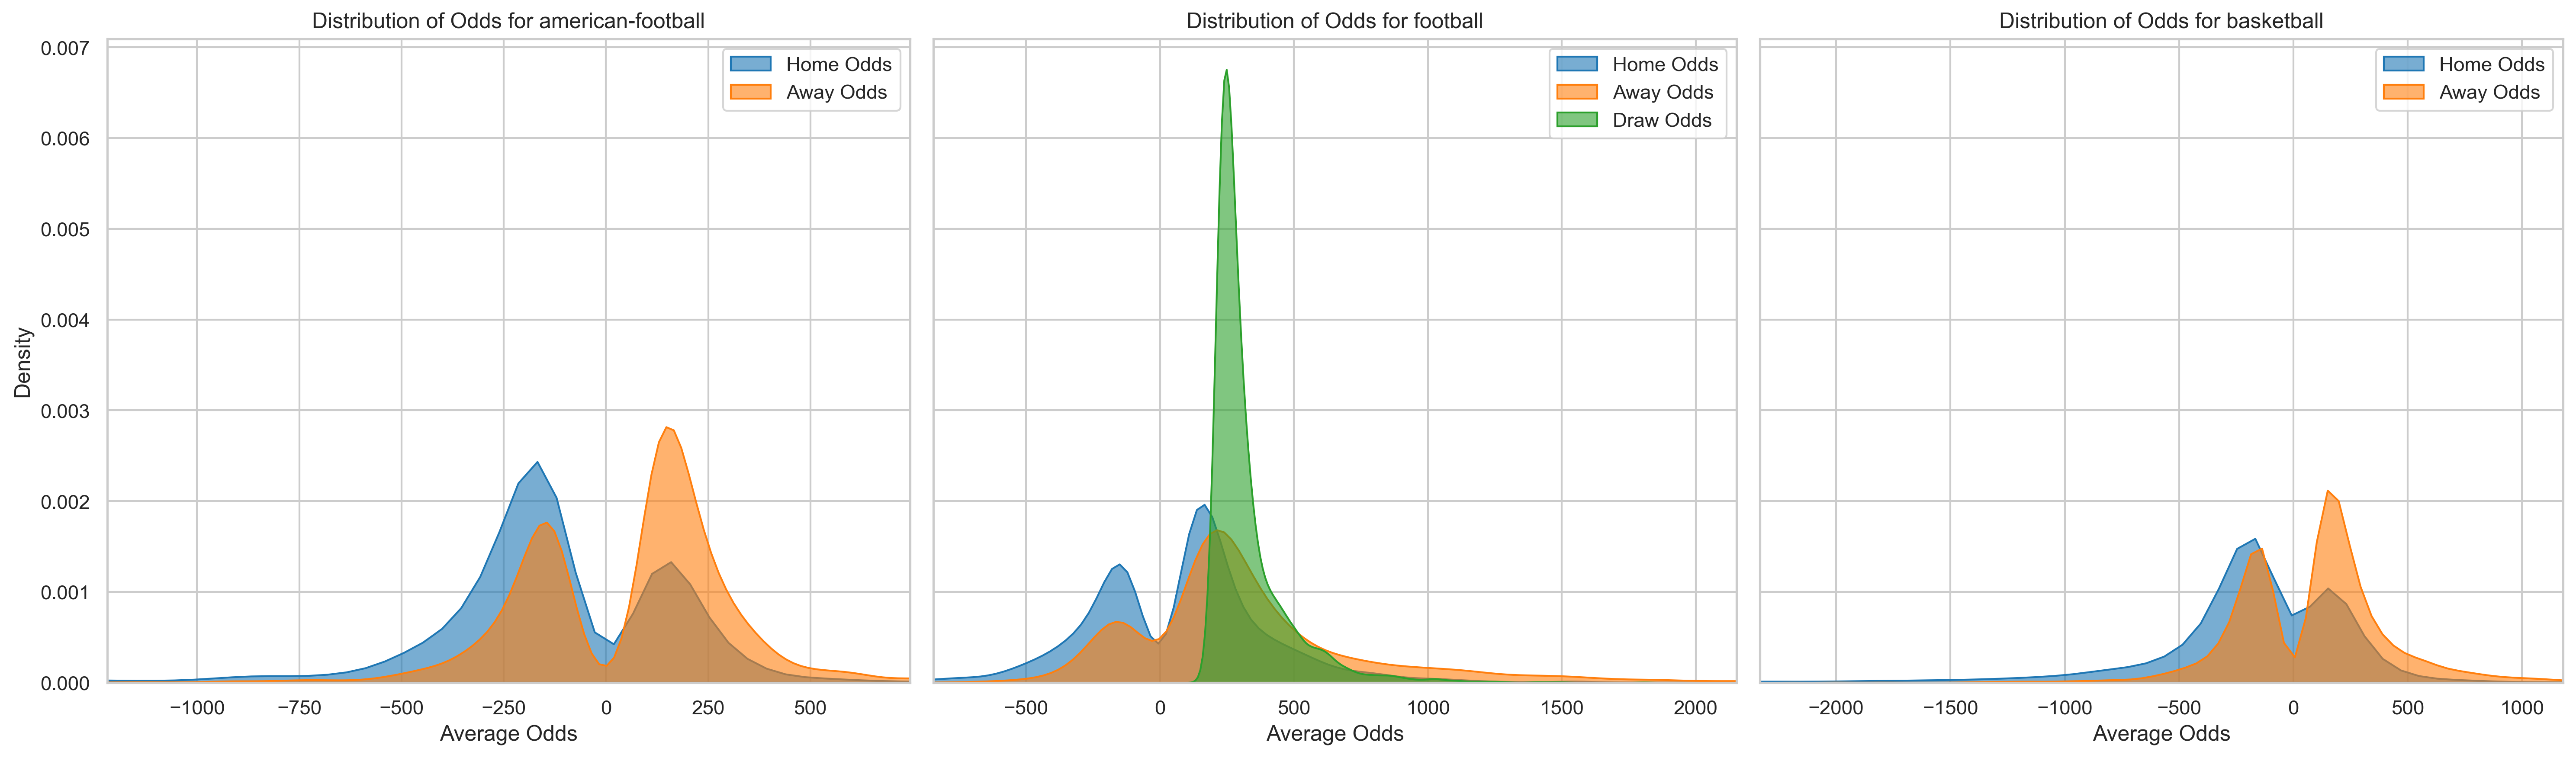
It appears that the distribution of home and away odds is bi-model, which makes sense given that there are usually teams that are favored to win when playing at home (e.g. top teams) and home teams that are underdogs (e.g. bottom teams). The same goes for teams when playing away. We also see a similar pattern if we break this down by sport.
| Sport | Avg Home Odds Mean | Avg Home Odds Min | Avg Home Odds Max | Avg Home Odds Std Dev | Avg Away Odds Mean | Avg Away Odds Min | Avg Away Odds Max | Avg Away Odds Std Dev |
|---|---|---|---|---|---|---|---|---|
| American Football | -132.64 | -8000.00 | 895.00 | 339.80 | 57.96 | -1600.00 | 1730.00 | 260.89 |
| Basketball | -208.78 | -13333.00 | 1935.00 | 628.38 | 86.43 | -6667.00 | 2512.00 | 385.27 |
| Football | 72.43 | -2917.00 | 2413.00 | 356.94 | 335.60 | -1132.00 | 3685.00 | 480.60 |
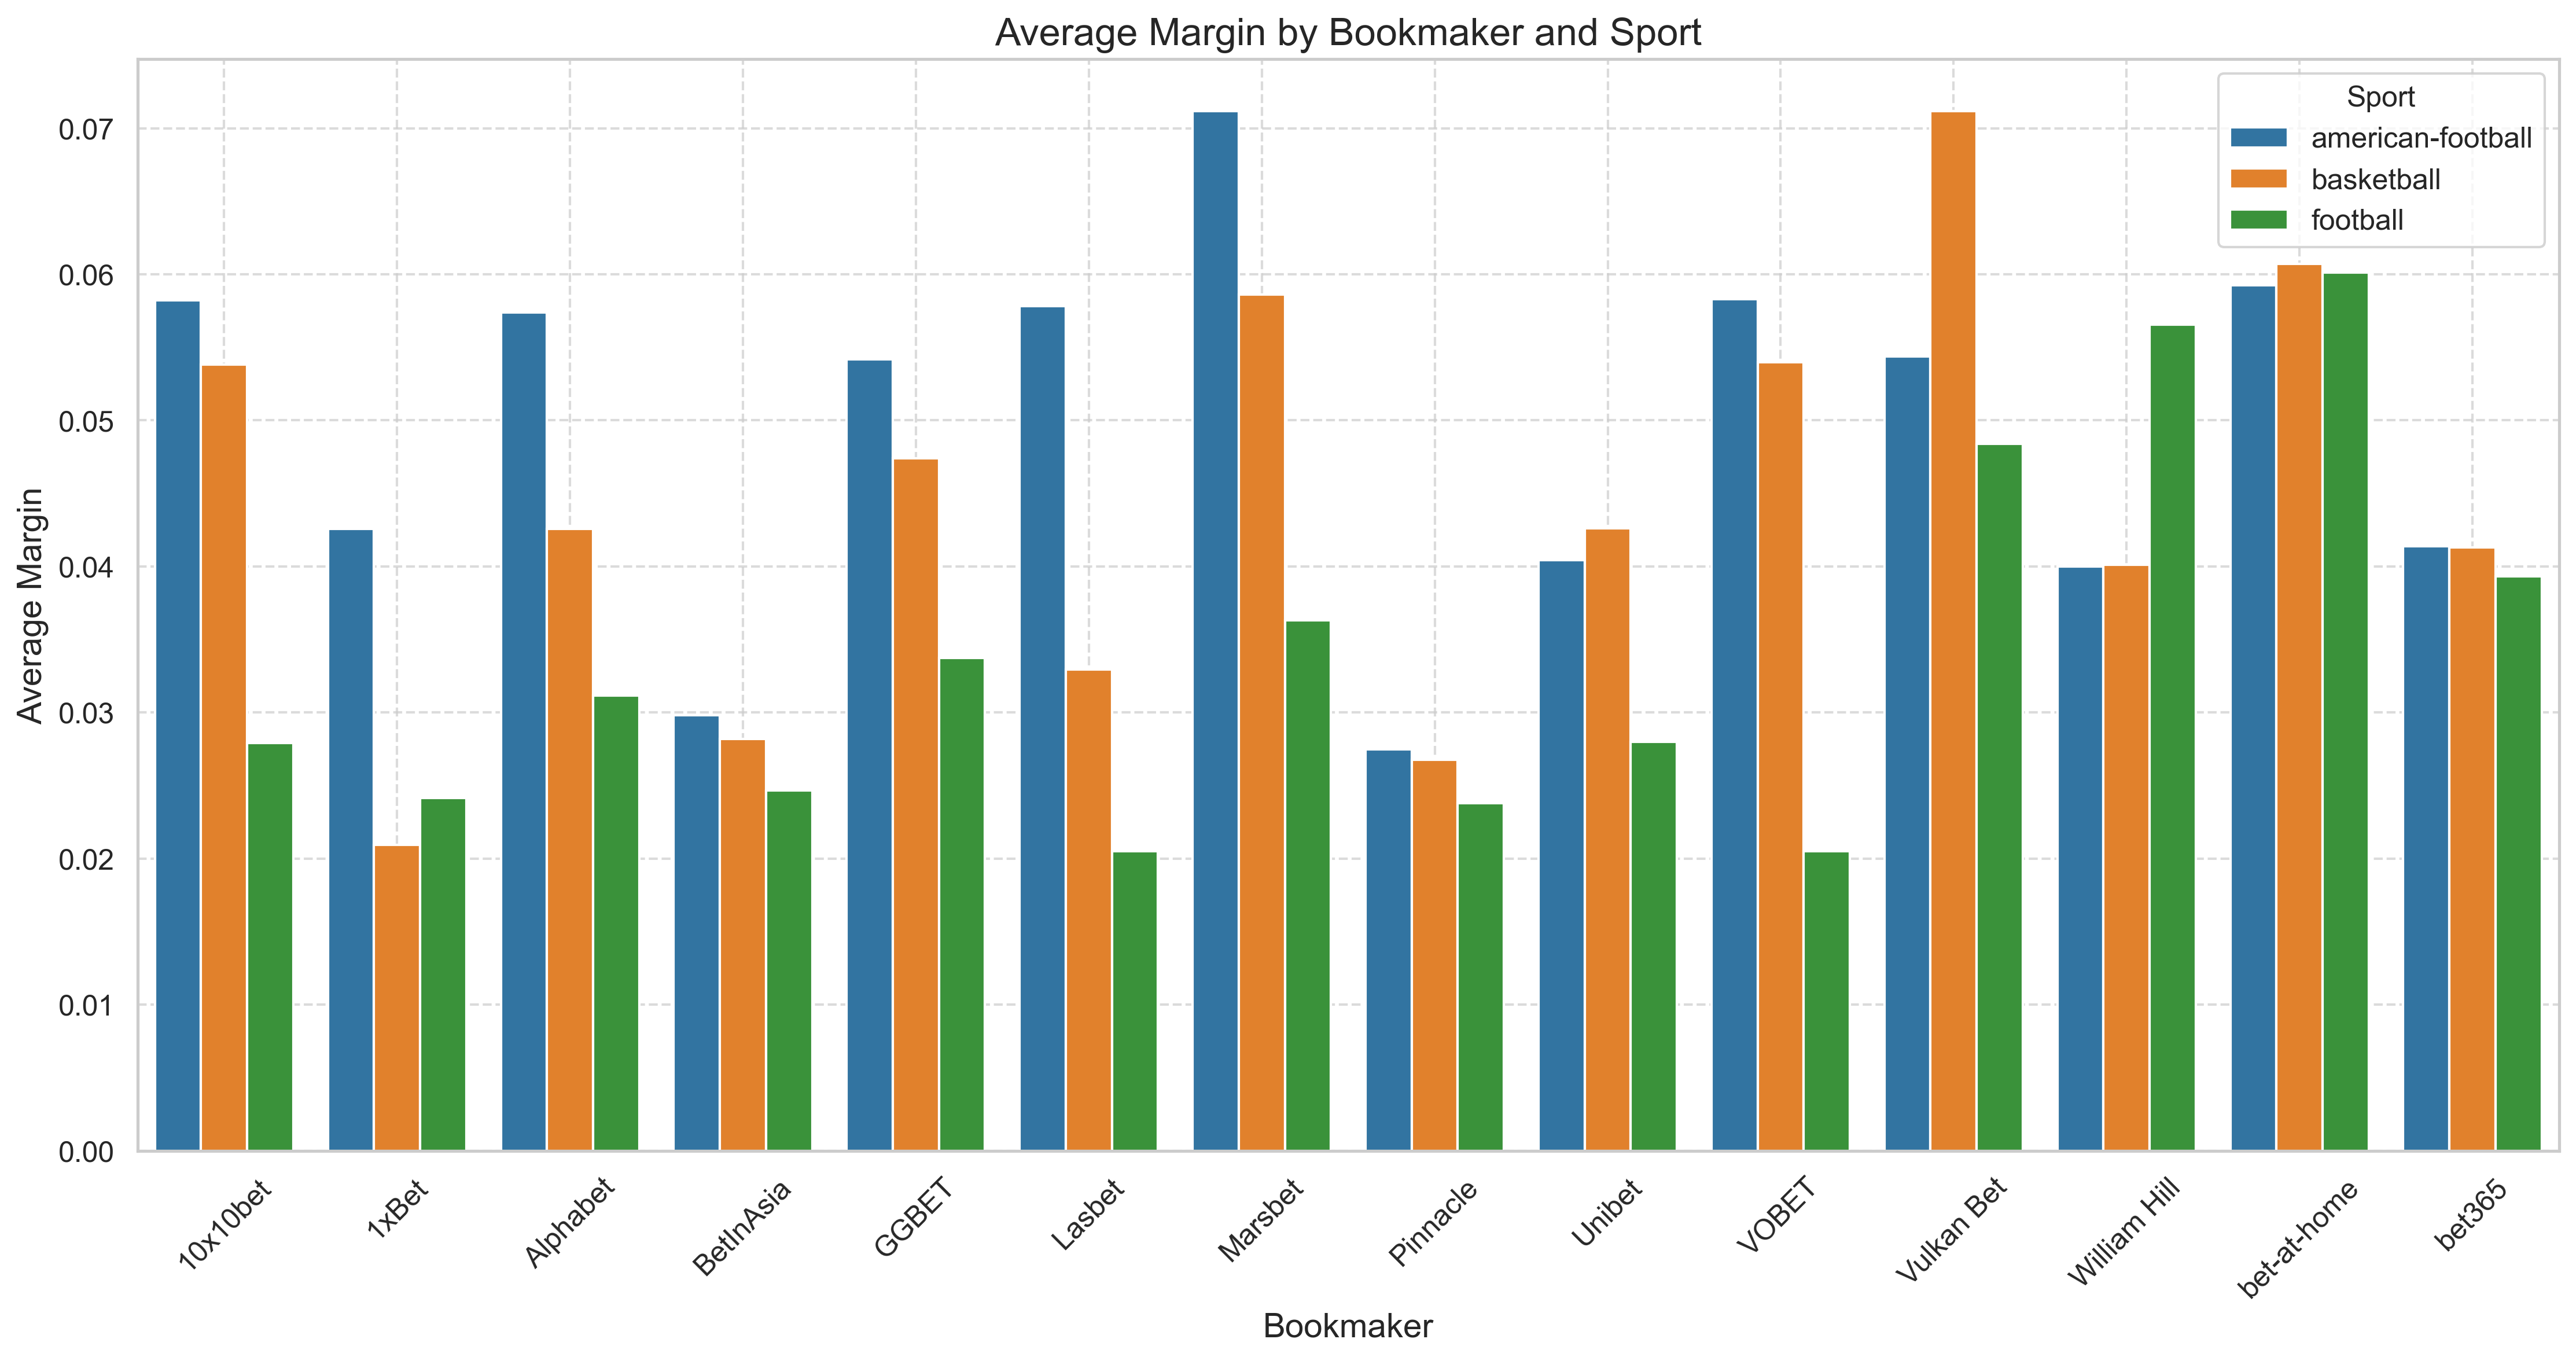
It’s important to remember that in every sportsbook context, bookmakers set bookmaker margins. This is the charge a bookmaker usually takes for setting the bet. The average margin for all bookmakers and games in my collected data is about 4% (SD = 0.6%). We can also compare the margin across sports shown below.
It might also be interesting to examine win and loss streaks. In the table, we can see that out of all the games, home and away win streaks represent about 14% of the games whereas home and away loss streaks represent about 7% of the games.
| Statistic | Mean Value |
|---|---|
| Mean Home Win Streak | 0.14 |
| Mean Away Win Streak | 0.14 |
| Mean Home Loss Streak | 0.08 |
| Mean Away Loss Streak | 0.07 |
I was also curious to know which teams have the most win and loss streaks. So across all three sports, Manchester City holds the highest win streak percentage, with 47% of their home games as part of a streak and 43% of their away games as part of a streak. On the other hand, Sheffield United leads in loss streaks, with 31% of their home games as part of a losing streak and 33% of their away games as part of a losing streak. Go figure.
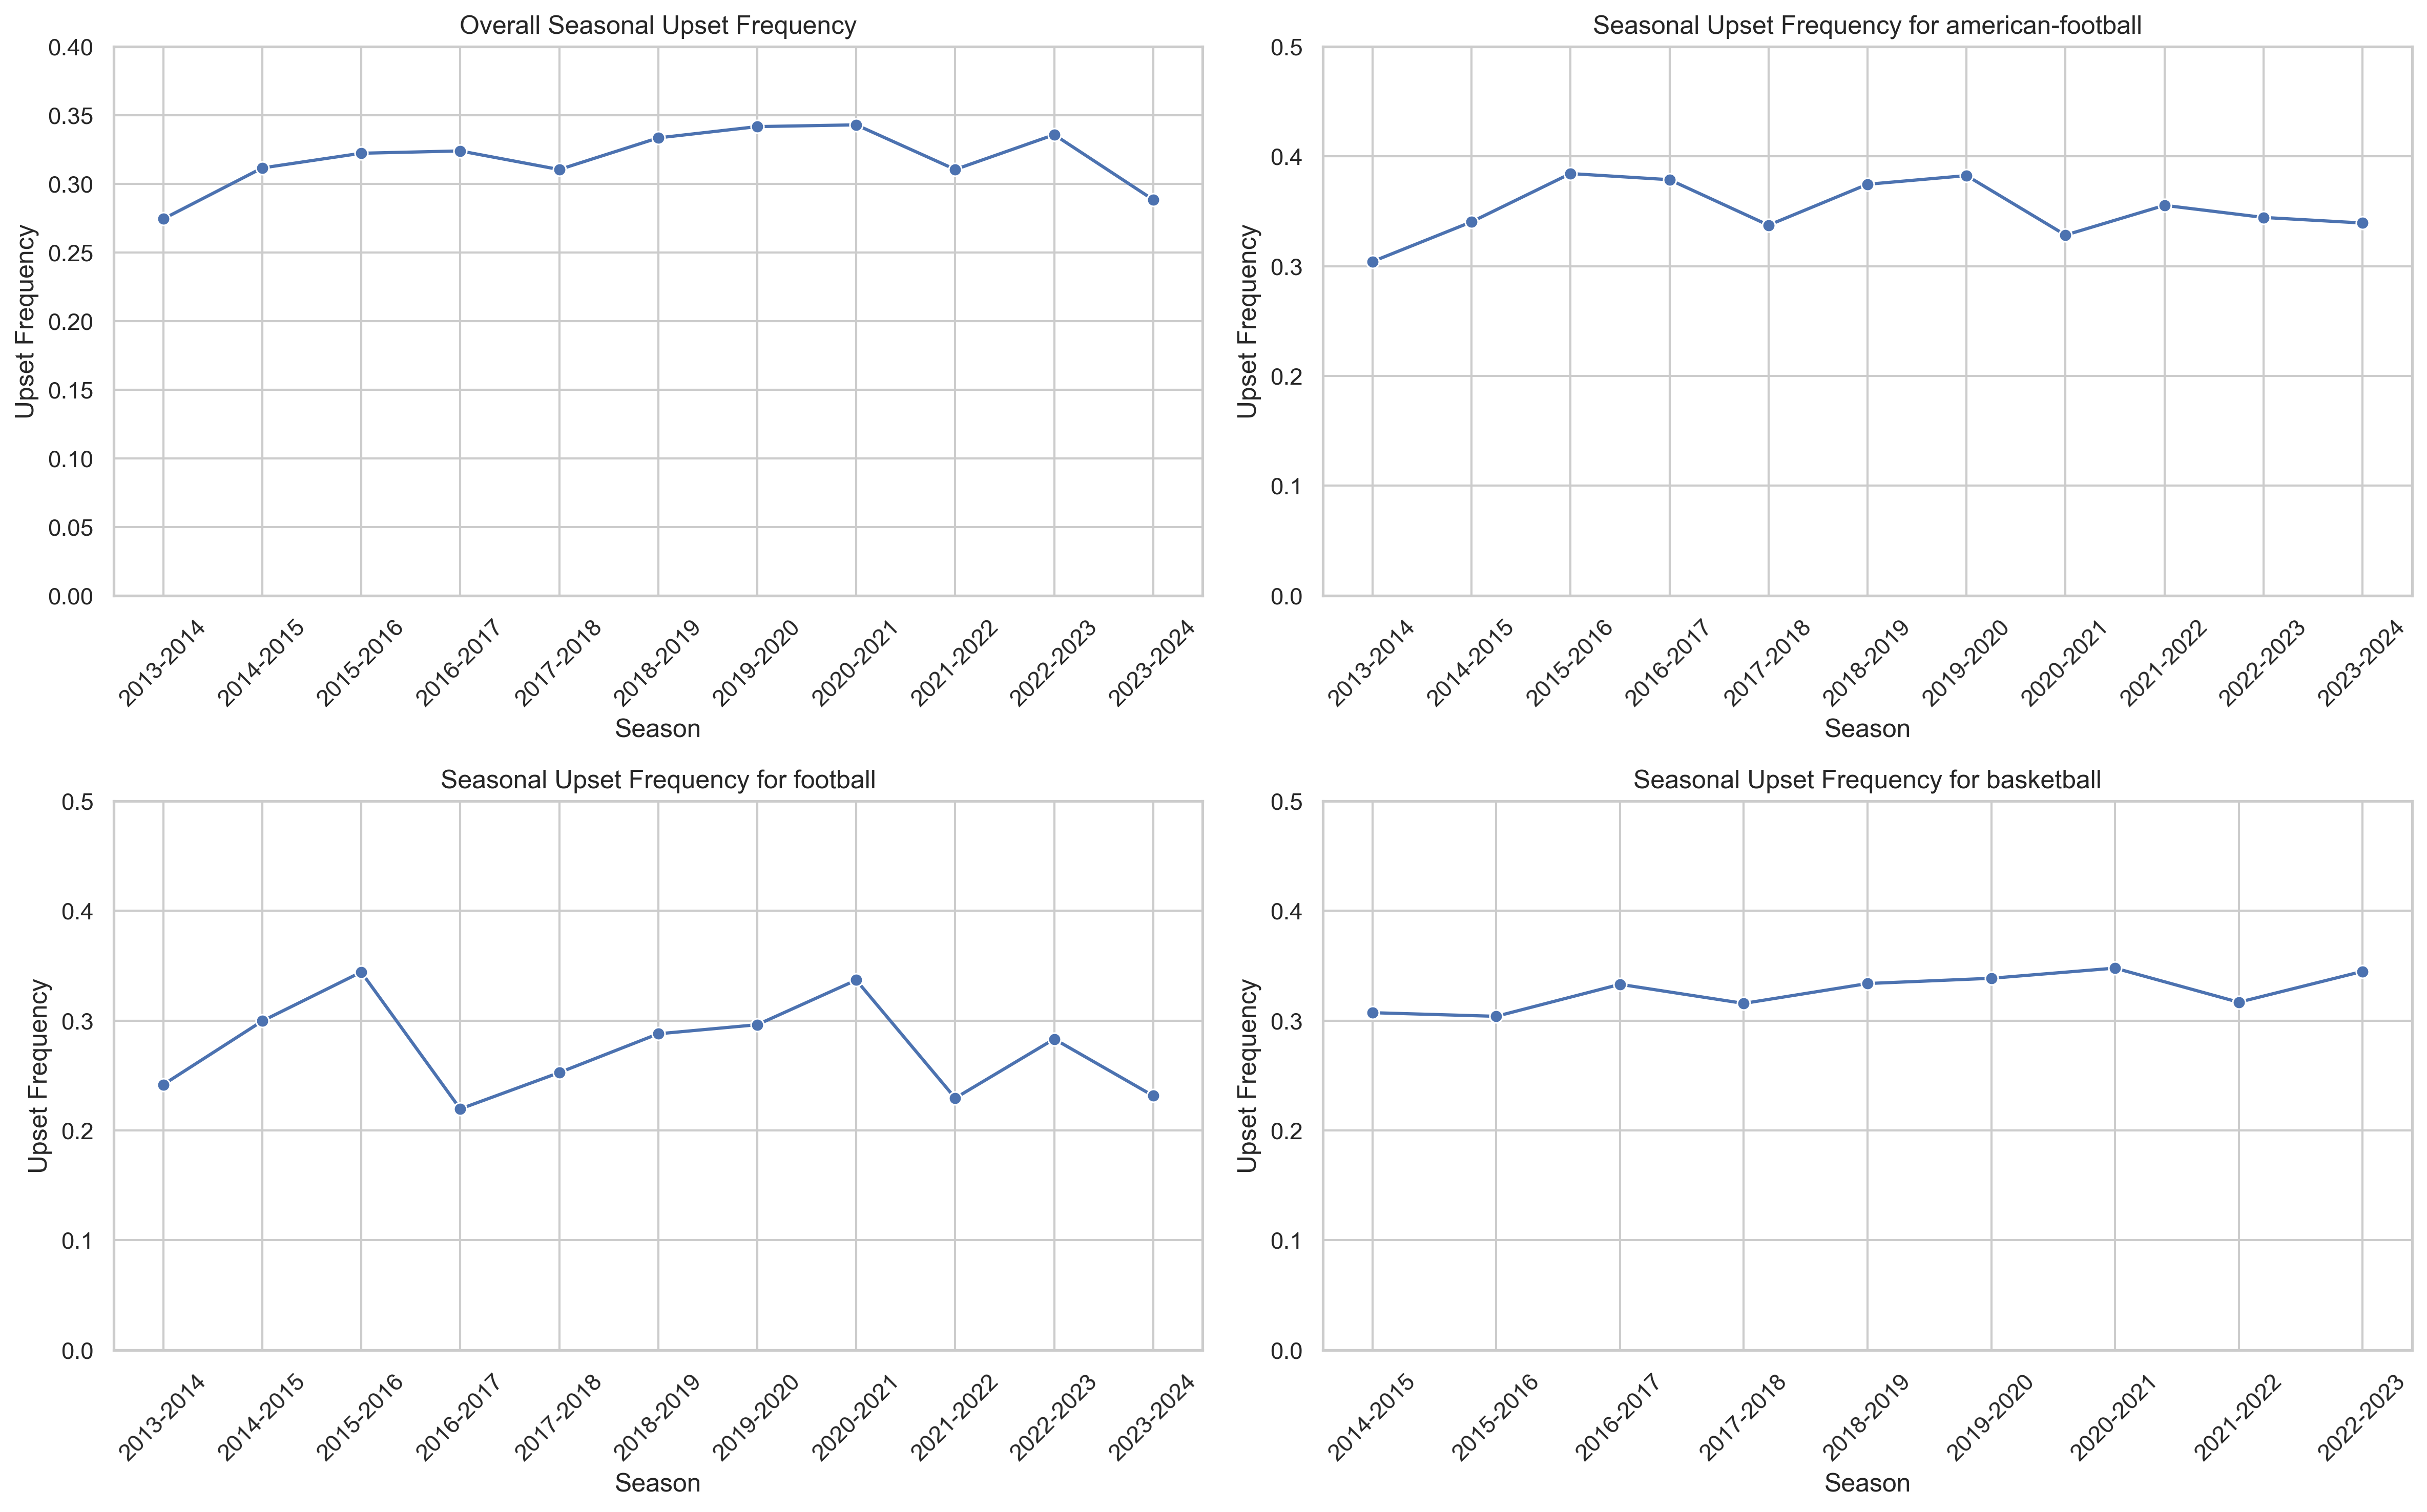
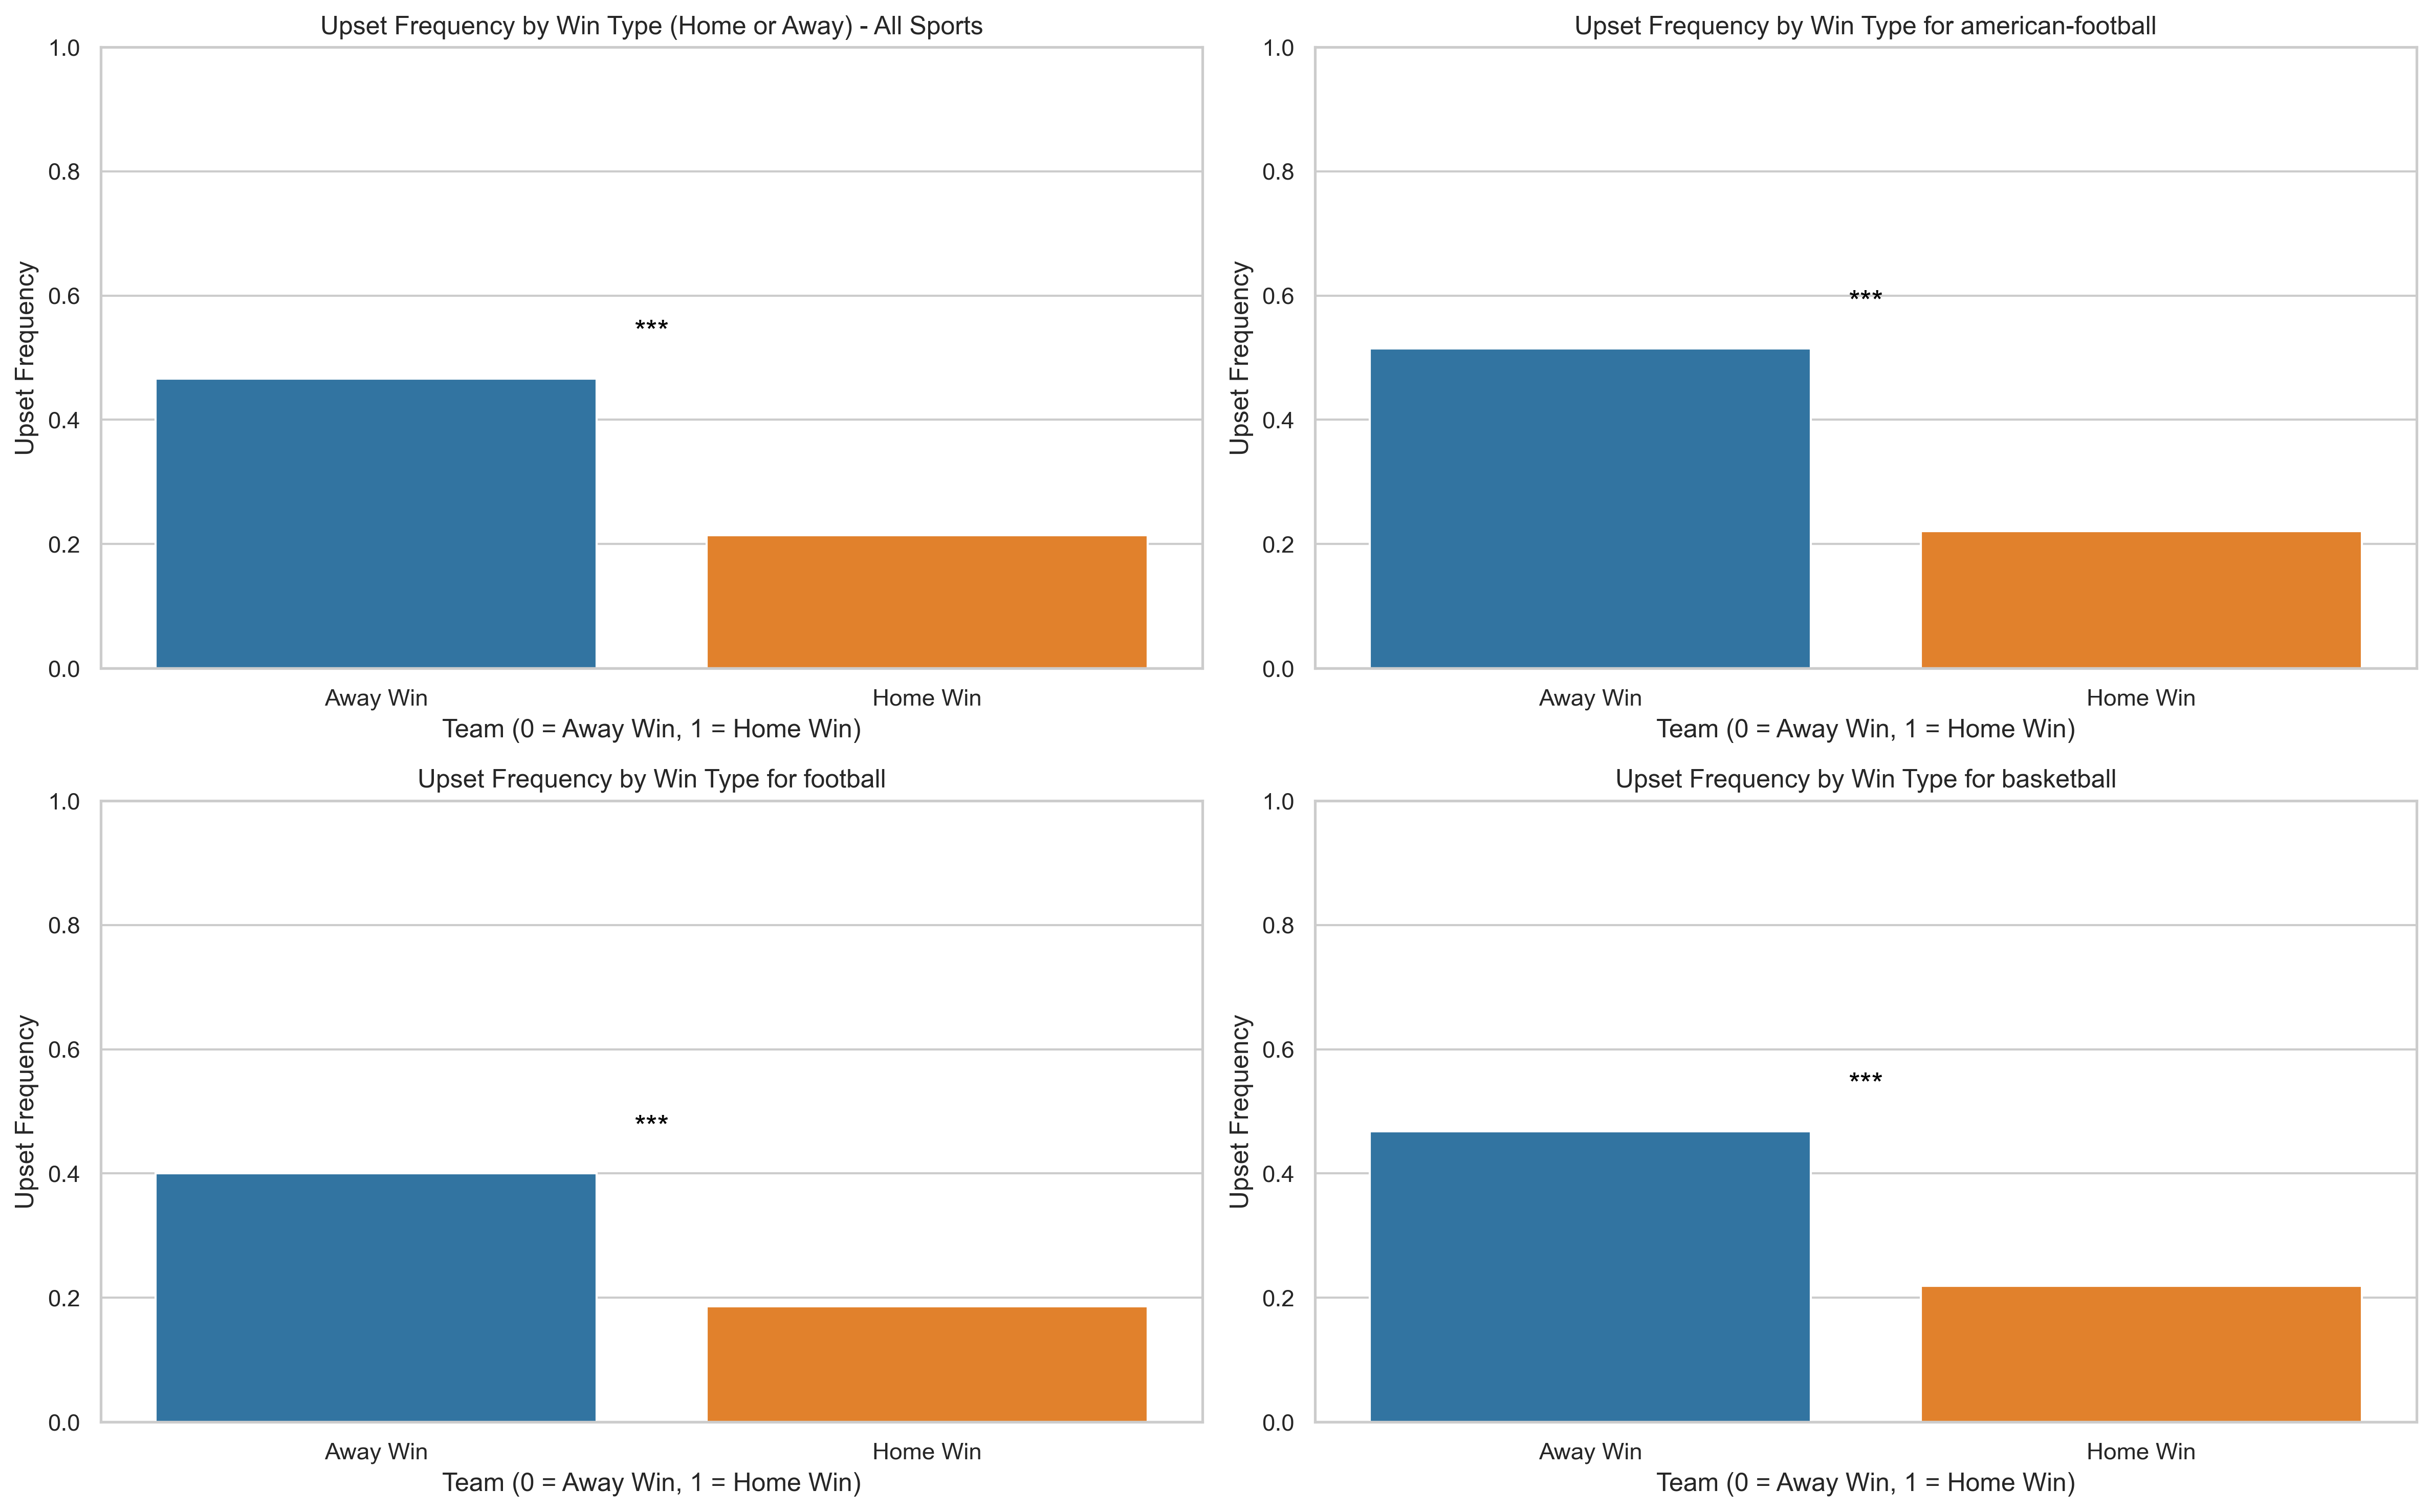
Another interesting variable to examine is upset frequency. Since this variable is binary, grouping it by season allows me to calculate the proportion of upsets for each season. We can see that this number appears to be around 30% for all sports give or take.
Are upsets more likely to occur for home or away teams? Surprisingly, what I found was that upsets are significantly more likely when an away underdog defeats a favored home team compared to the other way around. The three asterisks (***) denote a p-value less than 0.001.
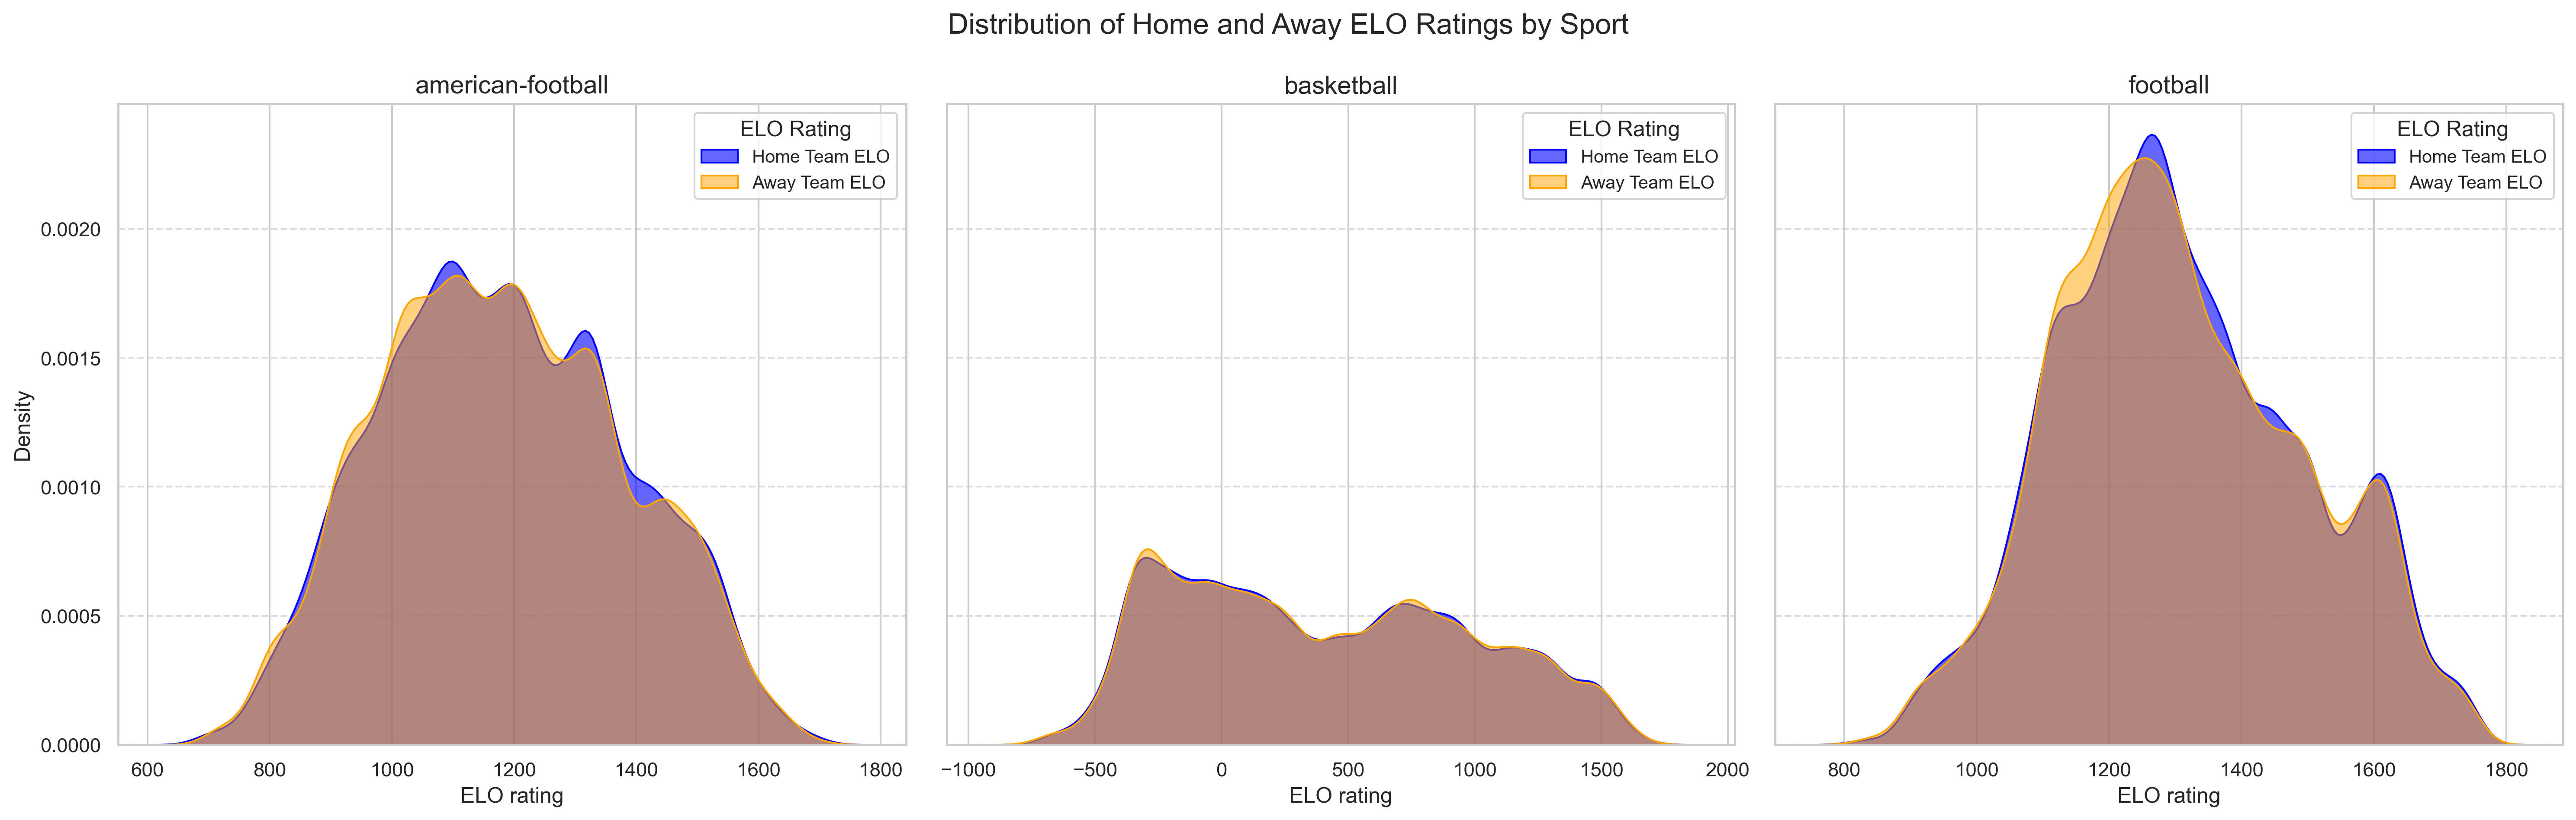
Let’s also take a look at home and away team ELO ratings. The overall average home ELO rating is 702.90 while the average away ELO rating is 702.33. I’ll plot the distributions of the average home and away ELO ratings by sport across all the seasons.
What might be interesting to know is the average home and away ELO ratings for teams with a higher than 50% adjusted historical win rate vs lower than 50% adjusted historical win rate.
| Metric | Average ELO Rating |
|---|---|
| Home Team ELO > 50% Adjusted Home Win Rate | 927.26 |
| Home Team ELO < 50% Adjusted Home Win Rate | 627.96 |
| Away Team ELO > 50% Adjusted Away Win Rate | 1351.75 |
| Away Team ELO < 50% Adjusted Away Win Rate | 653.10 |
With that, we can move onto the analysis Part 2.
If you need to read Part 1.
Check out the Methodology